18th September 2015
Introduction
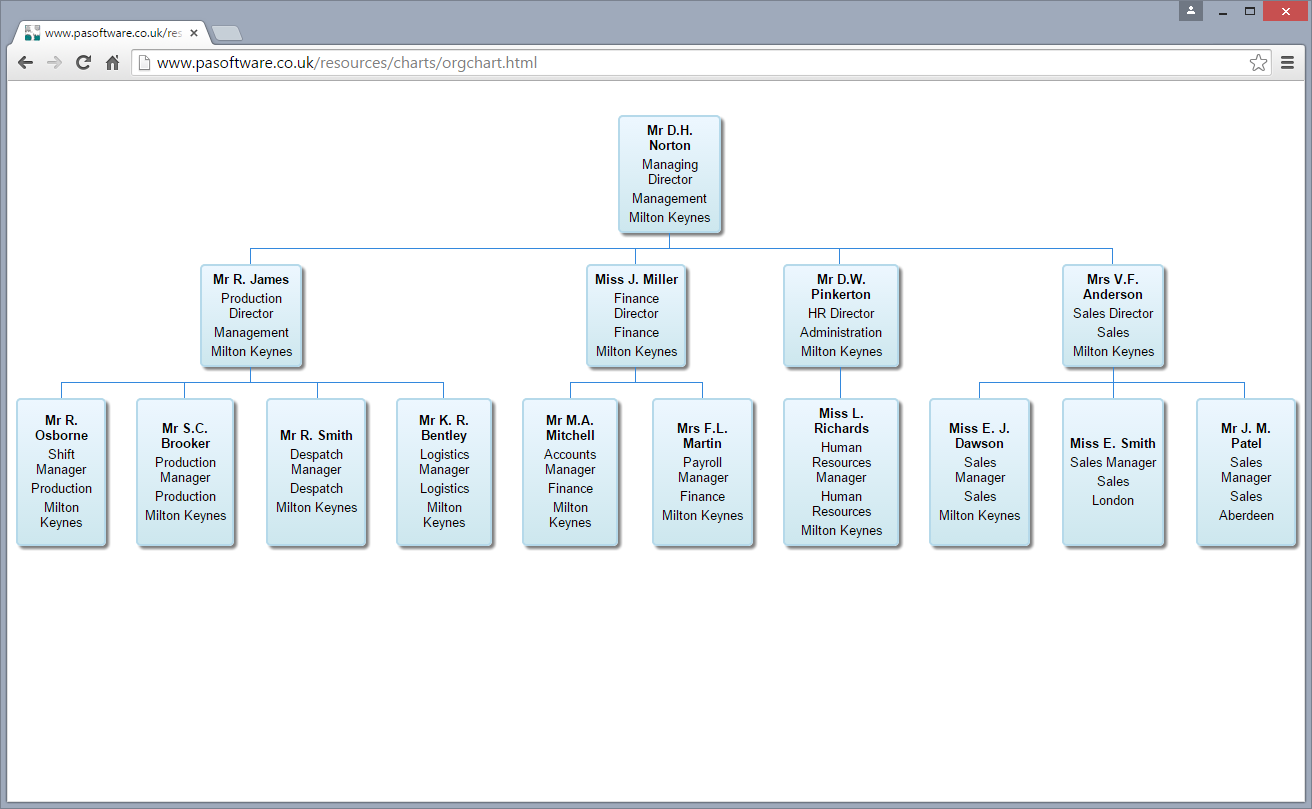
It is possible to generate organisation charts quickly and easily from the information already recorded within the People Inc. system. The Organisation Chart feature enables users to select areas of the organisation (or the whole organisation) and create a chart displaying employee information. These charts can then be printed or made available to others as required.
Update -
An integrated plugin tool has been added to the system in the latest release providing richer functionality and improved visualisations. More...

There are many different approaches that can be taken when producing these charts. The simplest approach is to extract the information from the People Inc. database and use another software tool to display it as an organisation chart. A number of software tools that are commonly available (for example Microsoft Office) will produce organisation charts.
An example organisation chart tool is available as a free download from this website.
Selecting Information
Basic organisation charts are created using details of employees (including the manager they report to). This information is held in an employee’s current Job History record within People Inc. A report template is used to extract this information (examples can be downloaded from our website).
Larger organisations will often want to produce organisation charts for a particular area (department, location, or division), or they may want to include just those employed in management grades within a chart. This can also be done using People Inc. by changing the way information is extracted from the database. For example, in the chart shown in this document (above) we have just included directors and managers.
In our example, we have chosen to display just basic details for each employee (name, job, department, location). Further details can be added if required.
Chart Type (vacant posts, succession planning)
It is possible to choose to display different information altogether using this kind of chart. For example, the chart could be based on the Job definitions in the system and show the organisational structure (including the current incumbent and where appropriate any vacant posts). Alternatively, to help with succession planning, the chart could be based on key employees and show any potential successors who have been identified within the organisation.
Using a Charting Tool
Once extracted, the information can be manipulated using an organisation charting tool. This enables users to add comments, custom links, add further information, change the formatting and layout. Chart tools are available as part of a wide range of software tools including Microsoft Office and Microsoft Visio.
Receive regular product updates by subscribing to our newsletter.
News Index
- Wizard Pack 4
- Access to Attendance Records
- Resource Planning
- Managing Competencies
- Self-Service Update
- Managing Tasks and Actions
- System Health Check
- Manage Salary Reviews
- Online Statistics
- Reporting Update
- ESS Scheduler
- Employee Directory update
- Training Matrix feature
- Partner Conference
- HR Policy Sign-off
- Company News Feature
- Software Clock
- People Inc. v4
- Absence Update
- Working with Partners
- Staff Assessments
- Features Browser
- Hints and Tips
- People Inc. Webinars
- Org-Chart update
- Wizards and Plugins Update
- 2018 People Inc. Partner Event
- Report Browser
- Mail Queue Manager
- Absence Wizards
- Software for HR
- On-line Payslips
- Custom Appraisal Forms
- Recalculate Data-Screen Wizard
- General Data Protection Regulation
- Training Wizards
- Manage Leavers
- New People Inc. Wizards
- Departmental Timesheets
- People Inc. 3.6
- Staff Timekeeping
- Social Mobility
- Employee Directory
- On-line Appraisals
- Expense Claims
- Organisation Charts
- Recruitment Web Publishing
- Company Statistics
- New Web Client
- Pay Review Process
- Driving Incidents
- Payroll Change Log
- People Inc. in the Cloud
- Employee Self-Service Customisation
- Delete Records
- New user training events
- People Inc. version 3.5 released
- Annual People Inc. Partner Event
- Report Writer Training
- Dealer Conference
- Charity automates standard HR tasks
- Pension Auto Enrolment
- Improving User Experience